What Lizard is and how it works
Table of Contents- Introduction
- Conventional Debugging
- Replay Debugging
- Existing Replay Debuggers
- Commands Supported
- What we do
- Design Goals
- Architecture and Implementation
- Reverse Watchpoints
- Activation Tree
- Special Issues
- Future scope
Introduction
Lizard's goal is to improve the process of debugging. It allows the user to step backwards, or go to any point in the execution of the program.There is a trace run, during which no debugging takes place, followed by an interactive replay session where you can go to any point in the execution time of the program.
Conventional Debugging
Lets see what happens in during conventional debugging.
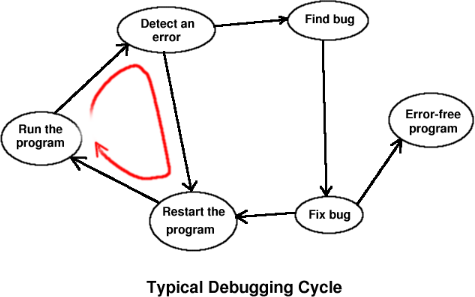
- The program is started, possibly through a debugger.
- An error occurs: i.e., the program shows some wrong output, or crashes, or a some variable shows a value it shouldn't have.
- The user (the guy who's using the debugger), figures out the bug. If not, then the user restarts the program — i.e. goes to step 1 again. This cycle may happen many times.
The effect of a bug might show up much later than the bug. The user then has to restart the program and execute till a point earlier than the place where the error was detected. If the state of the program is not as expected, the user again has to restart the program and repeat the procedure to localize the bug. Else, he tries to narrow down the region of search between the two points by executing forwards. This search for a bug is similar to a binary search procedure where each iteration incurs the cost of resatrting. The problem with restarting the program over and over again is that:
- The program re-execution consumes time.
- Inputs have to be entered again. To reproduce the bug, the same
inputs must be entered again.
This is either tedious or impossible. If the input is, say, from the keyboard, then the user has to enter the inputs again.
If the input is from a network, or microphone, or from a file that got deleted, then reproducing the same input is impossible without some sort of logging.
- Asynchronous events can't be reproduced exactly. A signal may have a different effect on a process if it is recieved at different times. To ensure that the bug is reproduced, the signal should arrive when the program was in the same state that it was when that signal arrived during the earlier run.
Replay Debugging
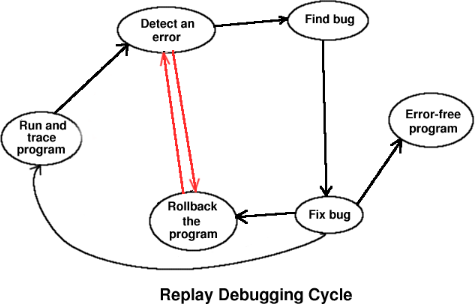
In replay debugging, the user initially runs the program through a tracer, which collects enough information to be able to replay it later. Then the user invokes the replayer which is an interactive debugging session. The user can browse the execution by going forwards and reverse in the program from any point to any point. This gives a significant reduction in the debugging cycle for the following reasons. First, the program does not have to be restarted when an error occurs, because the user can simply go back to some earlier state. Second, the inputs do not have to be entered again.
Existing Replay Debuggers
OmniscientThis is a replay debugger for multithreaded Java programs.
Spyder
This is a replay debugger for C. It is limited in its browsing
capabilities. The user can not step bacwards into a function call, or
into the last iteration of a loop from after it.
Commands supported
- fs : The same GDB's
stepcommand. - bs : The reverse analogue of GDB's
stepcommand. - fn : The same GDB's
nextcommand. - prev : The reverse analogue of GDB's
nextcommand. - jump_forward : Go to any point ahead.
- jump_backward : Go to any point behind.
What we do
The program goes through two stages. The first stage is called trace.Trace
In this step a program called as the tracer starts the debugged
program and monitors its execution till its termination. It logs the
state of the program at some points in the program. These saved
snapshots of program state are called checkpoints. All system calls
and asynchronous events such as signal are also logged.
Replay
This is an interactive debugging session in
which the debugger uses the trace data generated to allow a
replay. Whenever the user wishes to go to a line, say line no. 11, the
closest previous checkpoint is found and the state is restored to that
point, say line no. 7. After that, line nos. 8,9,10 are simply
executed to reach the correct program state. During execution the
effect of all system calls and signals is reproduced on the program
state without actually re-executing the system call.
Design Goals
- Faithful replay
The replay must happen in the same way that the trace happened. Control should flow the same way, variables should have the same value.
- Bounded replay time
The time for a replay command (such as
jump_forward) should have an upper-bound. - Minimize checkpoint size
The size of the checkpoints file should be small. Duh.
- Minimize intrusion
Intrusion is the impact or time overhead of running the program through the tracer. The aim is to minimize the ratio of the time taken by the program to execute without the trace to the time with the trace.
Faithful Replay
- Control flow
The tracer logs the control flow of the program.
(See trace and replay algorithms.)
- System calls
For every system call that occurs during the trace, the tracer logs
the following information:
- The location of the call in the code
- The location of the call in the trace file
- Which syscall it was
- The syscall arguments
- The return value
- Any other information that the system call writes into the process
address space, such as the read buffer in a
readsystem call.
During replay, most system calls are not executed. For example, if the system call is a
read, then during replay, the following happens:- we skip over the system call
- set the read buffer from the log
- set return value from the log
Some other system calls, such as mmap, are handled differently. See Special Issues.
Bounded replay time
User-defined checkpoint interval: The user can specify how often the system must checkpoint the program. Therefore, between two checkpoints code more thanCHECKPOINT_INTERVAL is never executed. To restore state
to any point , we find the nearest previous checkpoint and execute
code in the forward direction. So, this re-execution time can never be
more than CHECKPOINT_INTERVAL.
Minimize checkpoint size
Storing the entire address space of the process on disk in each checkpoint consumes too much disk space. An alternative way for storing the process state is:-
diff-ed checkpioints
The address space is XORed with the previous checkpoint, and then compressed using RLE.
Minimize intrusion
- Code instrumentation
One way to save control flow, is to have the tracer execute the debugged program as its child. It inserts breakpoints at each of the marker locations. When the program hits the breakpoint the tracer runs and saves the marker in the trace file. This implementaion has a disadvantage that on each marker 4 context switches between the tracer and tracee take place. This is a major tracing overhead.
A solution to this problem is to instrument the traced program, to write the marker itself. The overhead of switching context to the tracer is then removed.
- Saving dirty pages
To find out what part of the address space has changed, we can use the paging mechanism. After a checkpoint, all pages are set read-only. Then whenever a page fault occurs, the page is set writable and the writing instruction is restarted. At the next checkpoint all the writable pages are saved.
- Compiler-assisted checkpoints
The compiler knows what variables get assigned to in each basic block. The exact sequence of basic blocks is known between two checkpoints. Using this information, we can only save variables that could be changed since the previous checkpoint. This saved the additional overhead of running a 'diffing' operation over a entire address space whilt the program is stopped for a checkpoint.
- User-defined checkpoint interval
The user can set the CHECKPOINT INTERVAL which decides how often to stop a program for checkpointing. So, for applications that want to be stopped minimally, the user can set the CHECKPOINT INTERVAL to a high value, and the program is stopped less often.
However, the replay time is increased as the time between neighbouring checkpoints is increased. The choice is left to the user so that he can control the intrusion at the expense of replay time, as per the needs of the target application.
- Forked Checkpointing
Instead of writing the address space to disk, we can make a copy of it in memory and let the process continue. The writing of the checkpoint can be done asynchronously while the process runs, thereby reducing intrusion. This has an additional advantage of not having copies of the same unmodified pages in more than one place in memory, since the kernel uses Copy On Write.
Architecture and Implementation
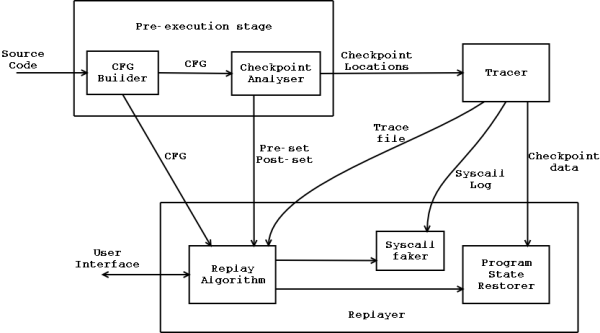
Lizard has three modules: a pre-execution stage, a tracer, and a replayer. The pre-execution stage analyses the program statically and tells the tracer how to save the control flow. The tracer runs the program, takes checkpoints, saves inputs to the program, and saves control flow according to instructions from the pre-execution stage. The replayer runs the program under a debugger and ensures that this program runs exactly the same as the program that ran during the trace.
The pre-execution stage consists of a patch to GCC and an independent
program. The tracer fork()s the program to trace and
uses ptrace to access the address space of the program
being traced. The replayer is an addition to GDB.
The Pre-execution stage
This has two modules, the basic-block analyser which finds the control flow graph of the program, and the checkpoint analyser which determines the edges to be marked, and the pre- and post- sets. (See trace and replay algorithms for an explanation of the control flow tracing algorithm.)The basic block analyser is a patch to GCC, which makes GCC output the control flow graph.
The Tracer Module
The tracer does three things. First, it must mark edges as they are traversed so that control flow is saved. Second, it must take checkpoints. Third, it must log inputs to the program.The tracer forks the the program to trace and monitors it. It is not an interactive program; there is no debugging interface at trace time. It runs the program to completion.
For monitoring the program, setting breakpoints, and running the
program, Lizard uses the ptrace(2) system call. Ptrace
gives the tracer access to the tracee's address space, and alerts the
tracer whenever the tracee hits a breakpoint or recieves a signal.
Control flow graph edges are marked by using software breakpoints. When a marked edge is traversed, the tracer writes the marker into a trace file.
The user specified variable CHECKPOINT_INTERVAL controls how often checkpoints are taken. At every marker, the tracer checks if the time interval since the last checkpoint is greater than this number, and takes a checkpoint if it is. It also writes a file that says which markers have checkpoints with them.
Each checkpoint is stored as a diff of the current address space and the previous checkpoint. For efficiency, every n checkpoints, we save a whole checkpoint. Here n is user specified.
Inputs to the program always occur through system calls. The read system call, for example, reads a buffer from a file into the tracee's address space.
The Replayer and Restorer
The replayer is the interactive program that the user uses to debug the program. It accepts thejump_forward,
jump_backward, etc. commands.
When given a commmand, it uses the control flow information gathered during trace time to determine which statement to go to and which checkpoint to restore. The replayer also uses information from the pre-execution stage analysis. (See trace and replay algorithms for details.)
To restore a checkpoint, the restorer is called. It reads the
checkpoint from the disk and sets up the address space of the debuggee
process such that it is in the right state. Like the tracer, it uses
ptrace to access the address space of the debuggee.
Reverse watchpoints
Forward watchpoints are a mechanism that allows the user to run the program till the value of a specified expression changes.Lizard has a command called reverse_watchpoints
<EXPRESSION> . This is the reverse analogue of forward
watchpoints (GDB's watch command.)
It allows the user to go to the last place where EXPRESSION was
changed. This lets the user make a query such as 'when last was the
value of variable x different from what it is now'.
Activation Tree
An execution of a function body is called an activation.Once the program executes, we can draw a tree, called an activation tree, that depicts the sequence and hierarchy of function calls made during the entire program execution.
In
this tree, the root is the activation of main(), the
functions called by main are its children in the tree. Time is
represented along the vertical axis.
For example, here's the activation tree for a Towers
of Hanoi program execution with 3 rings.
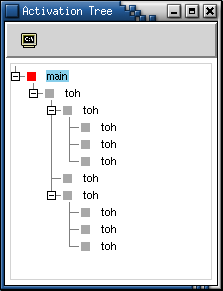
Besides being a great help in debugging recursive programs, this visualisation is also helpful in understanding programs that were written by someone else.
Special Issues
- Replaying programs with
mmap - Replaying programs with signals
Future Scope
- What-if capability
- Debugging multi-threaded uniprocessor programs
- Debugging on multiprocessors